HOW TO USE THE DICTIONARY
To look up an entry in The American Heritage Dictionary of the English Language, use the search window above. For best results, after typing in the word, click on the “Search” button instead of using the “enter” key.
Some compound words (like bus rapid transit, dog whistle, or identity theft) don’t appear on the drop-down list when you type them in the search bar. For best results with compound words, place a quotation mark before the compound word in the search window.
THE USAGE PANEL
The Usage Panel is a group of nearly 200 prominent scholars, creative writers, journalists, diplomats, and others in occupations requiring mastery of language. Annual surveys have gauged the acceptability of particular usages and grammatical constructions.
AMERICAN HERITAGE DICTIONARY APP
The new American Heritage Dictionary app is now available for iOS and Android.
THE AMERICAN HERITAGE DICTIONARY BLOG
The articles in our blog examine new words, revised definitions, interesting images from the fifth edition, discussions of usage, and more.
INTERESTED IN DICTIONARIES?
Check out the Dictionary Society of North America at http://www.dictionarysociety.com
bar graph
Share:
Tweet n. A graph consisting of parallel, usually vertical bars or rectangles with lengths proportional to the frequency with which specified quantities occur in a set of data.Also called bar chart. 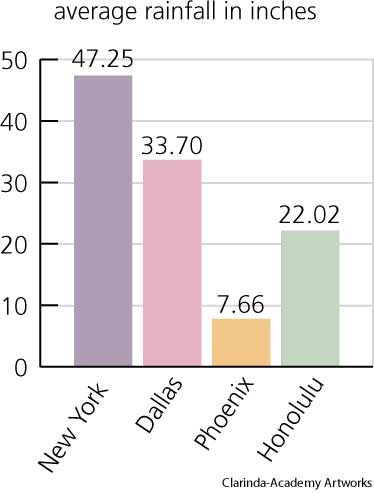 (click for a larger image) bar graphthe average annual rainfall of several US cities |
The American Heritage® Dictionary of the English Language, Fifth Edition copyright ©2022 by HarperCollins Publishers. All rights reserved.